PolyOne Announces 25% Increase in Quarterly Dividend
October 8, 2014
CLEVELAND – The Board of Directors of PolyOne Corporation (NYSE: POL), has declared a quarterly cash dividend of ten cents ($0.10) per share on the common stock outstanding, representing a 25% increase to the quarterly cash dividend and the fourth consecutive year of annual dividend growth. The $0.10 per share will be paid on January 7, 2015, to stockholders of record on December 15, 2014.
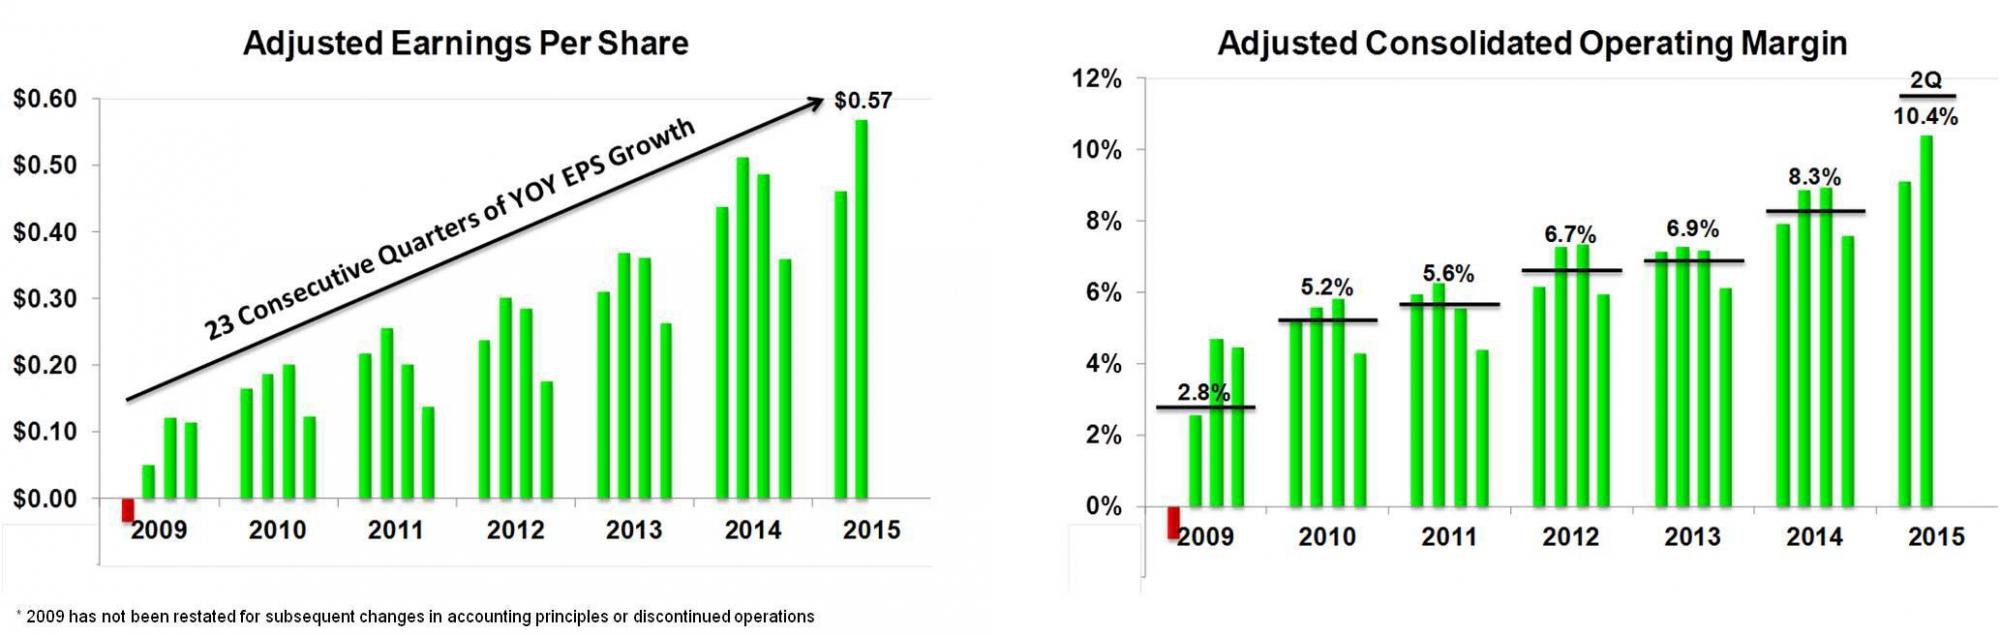
“We have increased our annual dividend 250% since we initiated it in 2011,” said Robert M. Patterson, president and chief executive officer, PolyOne Corporation. “This reflects the rapid pace at which we have strengthened our financial performance, and underscores the confidence we have in our ability to continue to achieve accelerated earnings expansion into 2015 and beyond.”
About PolyOne
PolyOne Corporation, with 2013 revenues of $3.8 billion, is a premier provider of specialized polymer materials, services and solutions. The company is dedicated to serving customers in diverse industries around the globe, by creating value through collaboration, innovation and an unwavering commitment to excellence. Guided by its Core Values, Sustainability Promise and No Surprises PledgeSM, PolyOne is committed to its customers, employees, communities and shareholders through ethical, sustainable and fiscally responsible principles. For more information, visit www.polyone.com.
To access PolyOne’s news library online, please visit www.polyone.com/news
Investor Relations Contact:
Isaac D. DeLuca
Vice President, Investor Relations
PolyOne Corporation
+1 440-930-1226
isaac.deluca@avient.com
Media Contact:
Kyle Rose
Director, Corporate Communications
PolyOne Corporation
+1 440-930-3162
kyle.rose@avient.com
Forward-looking Statements
In this press release, statements that are not reported financial results or other historical information are "forward-looking statements" within the meaning of the Private Securities Litigation Reform Act of 1995. Forward-looking statements give current expectations or forecasts of future events and are not guarantees of future performance. They are based on management's expectations that involve a number of business risks and uncertainties, any of which could cause actual results to differ materially from those expressed in or implied by the forward-looking statements. They use words such as "will," "anticipate," "estimate," "expect," "project," "intend," "plan," "believe," and other words and terms of similar meaning in connection with any discussion of future operating or financial condition, performance and/or sales. Factors that could cause actual results to differ materially from those implied by these forward-looking statements include, but are not limited to: our ability to realize anticipated savings and operational benefits from the realignment of assets, including the planned closure of certain manufacturing facilities; the timing of closings and shifts of production to new facilities related to asset realignments and any unforeseen disruptions of service or quality caused by such closings and/or production shifts; our ability to identify and evaluate acquisition targets and consummate acquisitions; the ability to successfully integrate acquired companies into our operations, retain the management teams of acquired companies and retain relationships with customers of acquired companies including without limitations Spartech Corporation; disruptions, uncertainty or volatility in the credit markets that could adversely impact the availability of credit already arranged and the availability and cost of credit in the future; the financial condition of our customers, including the ability of customers (especially those that may be highly leveraged and those with inadequate liquidity) to maintain their credit availability; the speed and extent of an economic recovery, including the recovery of the housing market; our ability to achieve new business gains; the effect on foreign operations of currency fluctuations, tariffs and other political, economic and regulatory risks; changes in polymer consumption growth rates where we conduct business; changes in global industry capacity or in the rate at which anticipated changes in industry capacity come online; fluctuations in raw material prices, quality and supply and in energy prices and supply; production outages or material costs associated with scheduled or unscheduled maintenance programs; unanticipated developments that could occur with respect to contingencies such as litigation and environmental matters; an inability to achieve or delays in achieving or achievement of less than the anticipated financial benefit from initiatives related to working capital reductions, cost reductions and employee productivity goals; an inability to raise or sustain prices for products or services; an inability to maintain appropriate relations with unions and employees; our ability to continue to pay cash dividends; the amount and timing of repurchases of our common shares, if any; and other factors affecting our business beyond our control, including, without limitation, changes in the general economy, changes in interest rates and changes in the rate of inflation. The above list of factors is not exhaustive.
We undertake no obligation to publicly update forward-looking statements, whether as a result of new information, future events or otherwise. You are advised to consult any further disclosures we make on related subjects in our reports on Form 10-Q, 8-K and 10-K that we provide to the Securities and Exchange Commission.
Reconciliation of Non-GAAP Financial Measures (Unaudited)
(Dollars in millions, except per share data)
Below is a reconciliation of non-GAAP financial measures to the most directly comparable measures calculated and presented in accordance with U.S. GAAP. Senior management uses adjusted operating income, adjusted EPS, and working capital to assess performance and allocate resources because senior management believes that these measures are useful in understanding current profitability levels and that current levels may serve as a base for future performance.
| Platform operating income mix percentage | 2005* | 2008* | 2010* | 2013 | 2014 1H |
|---|---|---|---|---|---|
| Global Color, Additives and Inks | $ 4.3 | $ 28.1 | $ 37.7 | $ 104.0 | $ 68.1 |
| Global Specialty Engineered Materials | 0.4 | 17.6 | 49.7 | 57.2 | 37.2 |
| Designed Structures and Solutions | - | - | - | 33.4 | 24.1 |
| Specialty Platform | $ 4.7 | $ 45.7 | $ 87.4 | $ 194.6 | $ 129.4 |
| Performance Products and Solutions | 75.7 | 31.3 | 54.0 | 56.0 | 33.6 |
| Distribution | 19.5 | 28.1 | 42.0 | 63.3 | 34.5 |
| Joint ventures | 91.9 | 28.6 | 18.9 | - | - |
| Corporate and eliminations | (51.5) | (425.1) | (27.7) | (82.4) | (91.7) |
| Operating income (loss) GAAP | $ 140.3 | $ (291.4) | $ 174.6 | $ 231.5 | $ 105.8 |
| Less: Corporate operating expense | 51.5 | 425.1 | 27.7 | 82.4 | 91.7 |
| Operating income excluding Corporate | $ 191.8 | $ 133.7 | $ 202.3 | $ 313.9 | $ 197.5 |
| Specialty platform operating mix percentage | 2% | 34% | 43% | 62% | 66% |
* Historical results include the Resin and Specialty Coatings businesses within the Performance Products and Solutions segment.
Press Resources
Investor News
Avient Announces Fifteenth Consecutive Annual Dividend Increase... More
Avient To Hold Third Quarter 2025 Conference Call... More
Avient Hires David N. Schneider as President of Specialty Engineered Materials Business Segment... More